The lowcountry terrain around Savannah, Georgia doesn't give up its secrets easily. What looks like flat, stable ground from above often conceals a hidden world of paleochannels, buried marsh deposits, and solution cavities in the underlying limestone. The humidity and shallow water table—typical for Chatham County—create a near-surface environment where traditional drilling alone can miss critical lateral variations. Seismic tomography (refraction/reflection) bridges that gap. When we run a 24- or 48-channel spread across a site near the Savannah River, the resulting velocity profiles reveal compressional and shear wave boundaries that correlate directly with engineering stratigraphy. Before finalizing foundation type, it's common practice to integrate these results with spt-drilling to calibrate N-values against seismic velocities, especially where the Hawthorne Formation shallows toward the Fall Line. Our team has deployed this method on everything from warehouse pads in Pooler to bridge approach studies along I-16, and the data consistently helps engineers avoid surprises during excavation.
We've mapped velocity inversions beneath Savannah—soft zones under stiffer crust—that only seismic tomography can resolve without disturbing the sample.
Method and coverage
Regional considerations
Deploying a 48-channel seismic spread in Savannah means dealing with the coastal plain's surface conditions head-on. The trigger switch on our weight-drop source gets a real workout during summer months, when afternoon thunderstorms saturate the topsoil and swampy depressions fill with standing water. Coupling geophones in saturated organic silt requires careful planting and sometimes a sandbag of dry material to maintain consistent contact. On industrial sites near the port, background vibration from container handling equipment and truck traffic can degrade the signal-to-noise ratio; we compensate by stacking shots and scheduling early-morning acquisition windows when ambient noise drops. The biggest interpretation pitfall lies in velocity inversions—a scenario we see frequently where a stiff desiccated clay crust overlies softer, normally consolidated clay below. Standard refraction processing would miss this, so we employ tomographic inversion algorithms that accommodate low-velocity layers. Every line we shoot in the Savannah metro area includes multiple reciprocal shots and a minimum of three-fold subsurface coverage to verify consistency before passing data to the engineering team.
Standards that apply
ASTM D4428/D4428M-14: Standard Test Methods for Crosshole Seismic Testing, ASTM D5777-18: Standard Guide for Using the Seismic Refraction Method for Subsurface Investigation, ASCE 7-22 Chapter 20: Site Classification Procedure for Seismic Design
Complementary services
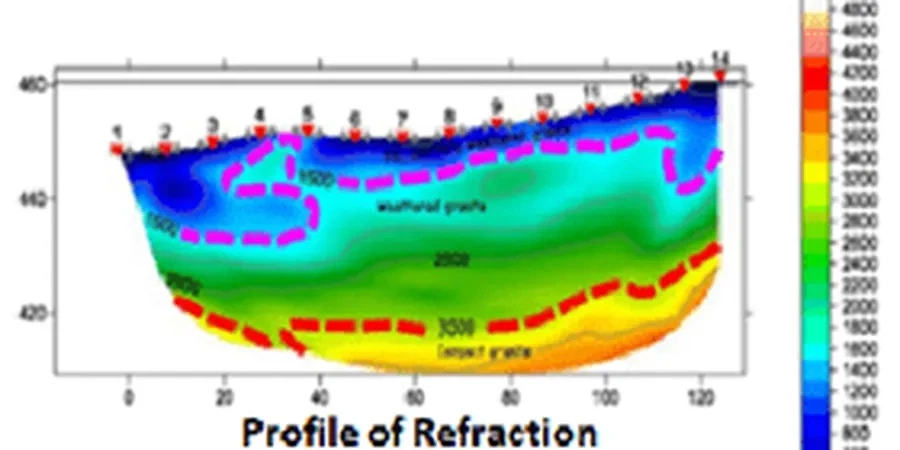
Seismic Refraction Tomography
This technique maps the top of competent bearing strata—commonly the Coosawhatchie or Marks Head formations in the Savannah area. With 4.5 Hz geophones spaced at 10 to 20 feet, we generate velocity cross-sections that distinguish soft alluvial silts from dense sands. Typical survey depths reach 60 to 100 feet using a sledgehammer or accelerated weight drop source. The data feed directly into site class determination per ASCE 7-22 Chapter 20 and help position test-pits in representative locations.
Seismic Reflection for Deep Bedrock Mapping
When the target is the top of the Floridan Aquifer limestone—which can sit 200 to 400 feet below Savannah—reflection profiling becomes the tool of choice. We use a 48-channel array with single-geophone groups and a higher-energy source to capture reflections from impedance contrasts at depth. The processed sections image karst features, fracture zones, and subsidence-prone areas that affect deep foundation design and groundwater modeling.
Typical parameters
Q&A
What is the typical cost for a seismic tomography survey in Savannah?
For a standard refraction line of 230 to 345 feet (24 geophones) in the Savannah area, budgets generally fall between US$2,340 and US$5,010 depending on access conditions, source type, and whether reflection acquisition is added. Urban sites with asphalt cutting and traffic control requirements trend toward the upper end of that range.
How do you handle high groundwater interference during seismic surveys near the Savannah River?
A shallow water table actually improves seismic transmission for P-wave refraction, since saturated soils have higher velocities than dry ones. For reflection surveys we may need to adjust the source offset to avoid strong ground roll and water-column multiples; our processing workflow includes F-K filtering and deconvolution routines that clean up the section.
Can seismic tomography detect sinkhole potential in the Savannah area?
Yes. Dissolution features in the Floridan limestone produce velocity anomalies that appear as low-velocity zones or disrupted reflectors on the processed sections. We have mapped several paleosinkholes beneath industrial sites west of I-95 where velocity drops of 40% or more indicated raveled zones requiring further investigation with targeted borings.
How long does a seismic tomography survey take, and will it disrupt my construction schedule?
A single 24-channel refraction line typically takes one field day, including layout, shooting, and demobilization. Data processing and interpretation are completed within three to five business days. We coordinate with Savannah-area contractors to sequence the survey during site clearing or before heavy equipment mobilization.