In the Savannah area, the interface between Pleistocene sands and the deeper Miocene clay layers can shift dramatically within a single site. Before you stake out a foundation or plan a stormwater infiltration system, you need to know where that conductive clay sits. Electrical resistivity imaging, and specifically vertical electrical sounding, gives us a continuous profile without having to punch a hole every ten feet. It's a go-to method in Chatham County because the high water table — often just 3 to 5 feet below the surface in the coastal plain — creates strong resistivity contrasts that make the data clean and interpretable. We run VES arrays with 4-pin and Wenner-Schlumberger configurations, then invert the apparent resistivity to true resistivity. The result is a layered model that tells you sand thickness, clay depth, and likely groundwater salinity, all critical for Savannah's coastal environment. When a project calls for direct physical sampling, we pair resistivity with test pits to ground-truth the geophysical data.
Resistivity is not about finding water — it's about finding the clay. In Savannah, that distinction saves foundations.
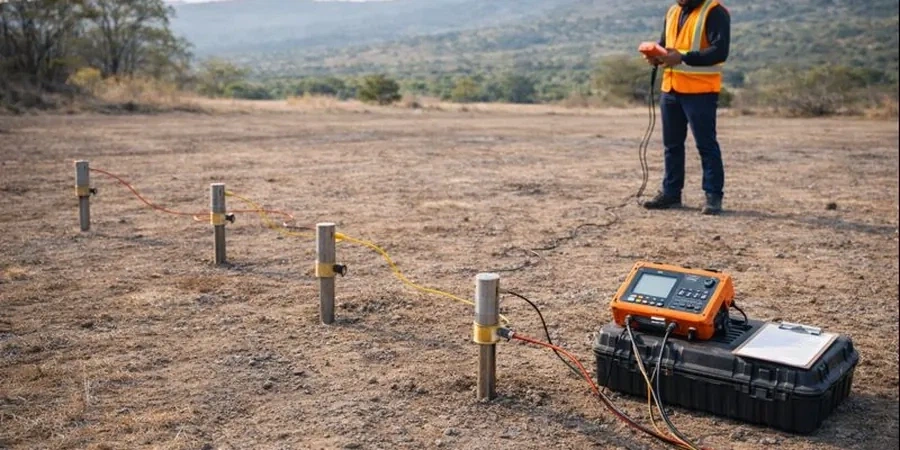
Method and coverage
Regional considerations
Savannah sits on a complex stack of Quaternary sands, silts, and clays overlying the Miocene-age Hawthorn Group, with the water table perched just a few feet below the surface across much of the city. The biggest risk in this setting is misidentifying a low-resistivity zone as a competent clay layer when it's actually a brackish water-saturated sand — a mistake that can lead to undersized footings or failed infiltration basins. Sinkhole activity in the underlying limestone, while less frequent than in central Florida, is still documented in Effingham and Chatham counties, making resistivity anomalies around potential voids something we actively hunt during surveys. Another local factor is the high lightning frequency during summer months, which forces us to schedule VES work in morning windows and monitor storm cells in real time to keep the crew and equipment safe. If you skip a proper resistivity investigation before designing a deep excavation, you may hit an unexpected sand channel that wasn't visible in sparse borings.
Standards that apply
ASTM D6431-18 Standard Guide for Using the Direct Current Resistivity Method for Subsurface Site Characterization, ASCE/SEI 7-22 Minimum Design Loads (geophysical site class input), USGS OFR 00-345 Field Methods Manual for Resistivity Surveys, IBC 2021 Section 1803 Geotechnical Investigations (geophysical methods accepted)
Complementary services
1D Vertical Electrical Sounding (VES)
Point measurements at strategic locations across your site to map vertical changes in resistivity. We provide a layered model showing sand, clay, and water table boundaries, with interpretation tied to regional USGS hydrogeologic cross-sections. Ideal for stormwater infiltration feasibility and preliminary foundation depth planning.
Resistivity Profiling & Data Integration
Horizontal profiling along survey lines, combined with VES points, to detect lateral changes in soil type and groundwater salinity. We integrate resistivity results with boring logs or CPT data when available, producing fence diagrams that show the subsurface in a way a single boring never can.
Typical parameters
Q&A
How deep can a VES survey reach in Savannah's coastal plain soils?
In the sandy, low-resistivity soils typical of the Savannah area, we can usually push a VES sounding to about 80 to 100 feet of investigation depth using a maximum current-electrode half-spacing (AB/2) of 150 feet. The actual depth of penetration depends on the resistivity contrast between layers. A dry sand overlying a saturated clay will give a strong signal and deeper penetration; a uniformly wet, saline profile will limit depth because the current doesn't want to go deep when the near-surface is already very conductive.
How much does an electrical resistivity survey cost in Savannah?
For a typical residential or light commercial site in the Savannah metro, a VES resistivity survey with 3 to 5 sounding points and a written report runs between US$640 and US$1,100. Larger projects or those requiring extensive 2D resistivity imaging profiles will be priced based on linear footage and number of sounding locations. The range covers field mobilization, data acquisition, inversion modeling, and the final engineering report with interpreted cross-sections.
Can resistivity tell the difference between brackish and fresh groundwater?
Yes, and that is one of the primary reasons we use it in the Savannah area. Fresh groundwater typically measures above 50 ohm-m in sandy aquifers, while brackish or saltwater-intruded zones drop below 10 ohm-m, sometimes as low as 1 ohm-m. By mapping these low-resistivity zones, we can delineate the freshwater/saltwater interface, which is a major concern for coastal construction dewatering and for deep foundation durability. We calibrate our resistivity models against available USGS monitoring well data to confirm the interpretation.