Savannah’s historic district and the expanding Southside don’t just differ in architecture — they sit on surprisingly different ground. The older downtown rests on relatively shallow Pleistocene sands and silts, while areas south of DeRenne Avenue often encounter thicker layers of compressible clay that amplify ground motion in ways that a blanket code coefficient can’t capture. We got involved in seismic microzonation here after seeing engineers apply uniform site factors across the entire Chatham County map, missing the sharp transition between NEHRP Site Class D and E that runs through parts of Pooler and Georgetown. A detailed MASW survey combined with SPT drilling lets us map shear-wave velocity profiles street by street, so the structural team isn’t guessing about site amplification. This type of work matters especially where the Floridan aquifer is shallow — high groundwater in Savannah routinely skews VS30 estimates when only surface methods are used.
Savannah’s shallow groundwater and layered coastal sediments create a site response puzzle that default code categories simply weren’t built to solve.
Method and coverage
Regional considerations
In Savannah we often find that the biggest risk isn’t the magnitude of the design earthquake — it’s the mismatch between a site’s actual ground response and the default values picked off a county-wide hazard map. The soft alluvial clays that fill old river channels and marshlands around the Savannah National Wildlife Refuge tend to amplify ground motion at periods that coincide with two- and three-story structures, something that becomes apparent only when a microzonation study maps the thickness and shear-wave velocity of those deposits. Foundation designs that ignore this amplification can end up with interstory drift problems that surface years later. We also see contractors underestimate how fast groundwater can rise after heavy rain, which changes effective stress and can shift a site from Class D to Class E behavior seasonally. A microzonation that only considers dry-season data misses that reality, and the resulting spectral accelerations won’t tell the full story for a project that has to perform over a 50-year service life.
Standards that apply
ASCE 7-22 Chapter 21 — Site-Specific Ground Motion Procedures, ASTM D4428/D4428M — Crosshole Seismic Testing, NEHRP Recommended Provisions — Site Classification, NCEER/NSF 1997 — Liquefaction Resistance of Soils (Youd-Idriss 2001 update), ASTM D1586 — Standard Penetration Test
Complementary services
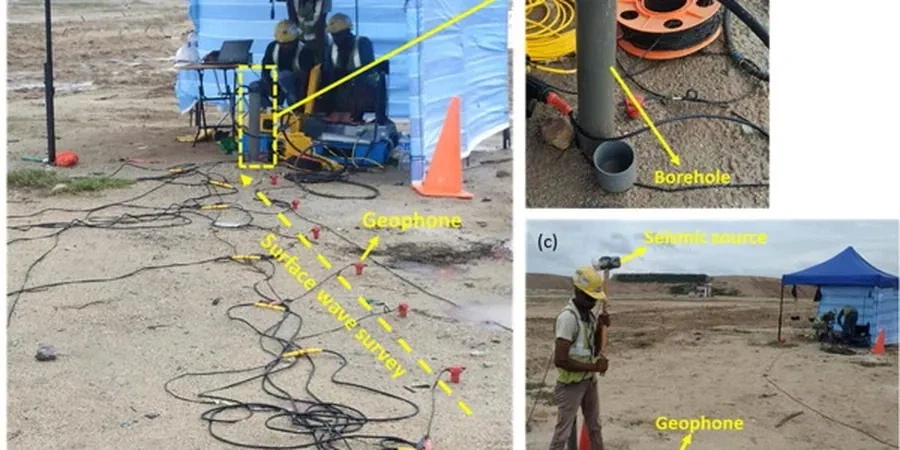
Surface Wave and Downhole Velocity Testing
We run active MASW lines at multiple orientations on each lot and supplement them with passive microtremor recordings where lot size permits. In areas with shallow groundwater, such as the neighborhoods east of Truman Parkway, we add downhole velocity checks to calibrate the surface-wave dispersion curves. The result is a VS profile with enough resolution to identify velocity inversions — soft clay under stiff sand — that would otherwise be missed and could lead to underestimation of site amplification.
Geotechnical Integration and Spectral Mapping
Velocity data on its own isn’t enough; we tie every VS profile to SPT blow counts, grain-size distributions, and Atterberg limits from nearby borings so that the amplification factors are grounded in actual soil behavior. This integrated dataset feeds into one-dimensional equivalent-linear site response analyses, producing maps of SDS and SD1 across the project footprint. For larger tracts, we deliver GIS-ready shapefiles that the civil and structural teams can overlay directly on their grading and foundation plans.
Typical parameters
Q&A
At what project scale does seismic microzonation become necessary in Savannah?
Typically once a project covers several acres with varying soil conditions, or when essential facilities like hospitals and emergency response centers are being designed. In Savannah, the transition from Pleistocene terraces to Holocene floodplain deposits can happen over a few hundred feet, so any development that straddles two NEHRP site classes benefits from microzonation. Even smaller infill projects in the historic district sometimes request it when the structural engineer wants to justify a site-specific reduction in design spectral accelerations.
How much does a seismic microzonation study cost in the Savannah area?
For most sites in Chatham County the total investment falls between US$4,310 and US$16,540, depending on how many MASW lines and calibration borings are needed and whether passive array measurements are required for deeper velocity profiles. Larger parcels with multiple soil transitions push toward the upper end because they demand denser spatial coverage to map the changes in site class accurately.
Does Savannah’s shallow groundwater affect the VS30 measurements?
Yes, and it is one of the first things we account for. Saturated sands and silts can transmit shear waves faster than the same material in a dry state, but the effect is not uniform across all frequencies. We use downhole velocity checks and compare results with CPT pore pressure dissipation tests when available to separate true stiffness changes from saturation effects, ensuring the VS30 value reflects the soil skeleton rather than just the water table.
What earthquake sources drive the seismic hazard for Savannah?
The hazard is dominated by two source types: the Charleston seismic zone about 100 miles up the coast, which produced the 1886 earthquake, and the smaller but closer faults in the Piedmont and Coastal Plain that generate moderate events. Microzonation for Savannah therefore has to consider both the long-period energy from a Charleston-type event and the short-period shaking from a local moderate quake, because the soft coastal soils respond quite differently to each.