Savannah's historic grid, laid out by Oglethorpe in 1733, sits atop a complex stratigraphy of Quaternary-age barrier island and back-barrier deposits that shift dramatically within a single city block. The grain size distribution of these sediments, ranging from clean dune sands near the coast to the silty clays and organics of the abandoned meander channels further inland, dictates everything from foundation drainability to liquefaction susceptibility. Our laboratory has processed thousands of samples from across Chatham County, and we know that a simple visual classification is rarely enough: the fines content and the shape of the gradation curve are what determine real engineering behavior. We run the full mechanical sieve stack followed by hydrometer analysis as a single, integrated test, providing a continuous particle size distribution from the gravel fraction down through the colloidal clays that are common in the low-lying marsh-edge zones of Savannah.
A unified gradation curve from 4.75 mm down to 0.001 mm gives you the full story that a simple wash screen never will.
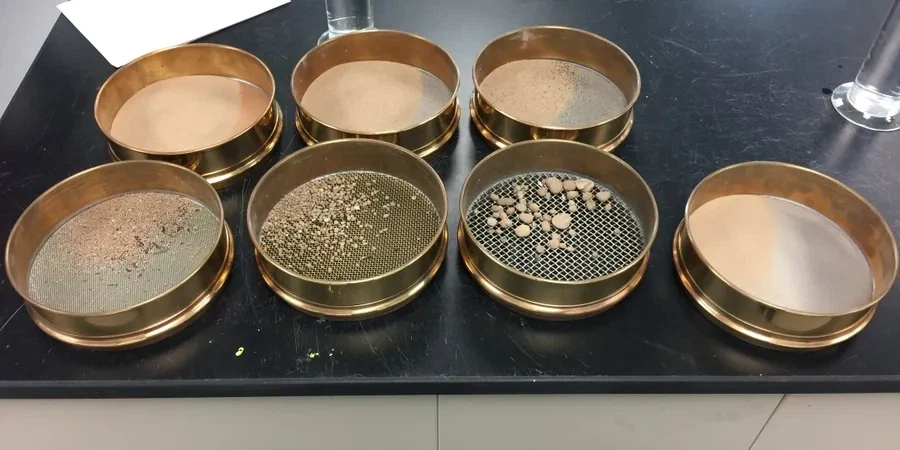
Method and coverage
Regional considerations
The contrast between the sandy Pleistocene terraces of the Ardsley Park area and the soft, organic-rich clays underlying the lowlands near the Savannah River illustrates the risk of skipping a thorough grain size analysis. In the higher, well-drained sections of the city, the soils are predominantly medium to fine sands with trace silt, and the coefficient of uniformity (Cu) often falls below 2.5, indicating a poorly graded material that can densify under vibration. Down by the waterfront and along the canal corridors, we routinely encounter micaceous silts and fat clays where the hydrometer fraction exceeds 60% passing the #200 sieve, and the activity ratio points to moderate to high swell potential. If a geotechnical report treats all Savannah soils as the same material, the result is either an over-designed, costly foundation or, worse, a pavement section that fails prematurely from frost heave and drainage issues. Our combined sieve-and-hydrometer report lets the design engineer see exactly where each soil sample falls on the USCS classification and what that means for construction.
Standards that apply
ASTM D6913-17: Standard Test Methods for Particle-Size Distribution (Gradation) of Soils Using Sieve Analysis, ASTM D7928-21e1: Standard Test Method for Particle-Size Distribution (Gradation) of Fine-Grained Soils Using the Sedimentation (Hydrometer) Analysis, ASTM D2487-17: Standard Practice for Classification of Soils for Engineering Purposes (Unified Soil Classification System), AASHTO T 88: Standard Method of Test for Particle Size Analysis of Soils
Complementary services
Complete Gradation Package (Sieve + Hydrometer)
Full particle size distribution from coarse gravel to clay colloids. We oven-dry, split, and wash the sample, run the full sieve stack on a mechanical shaker, then transfer the fines to a sedimentation cylinder for a 24-hour hydrometer test with temperature-corrected readings. The final deliverable includes the combined gradation curve, D-values, USCS classification per ASTM D2487, and a brief interpretive note on the material's likely engineering behavior based on our experience with Savannah-area formations.
Wash #200 and Sieve Analysis Only
A faster, lower-cost option for clean sands and gravels where the fines content is expected to be low. We wash the sample over a #200 sieve, dry and sieve the retained fraction, and report the percent passing as a single value along with the coarse gradation curve. This test is suitable for concrete aggregate qualification, filter sand specification checks, and preliminary site characterization where the hydrometer fraction is not required by the design brief.
Typical parameters
Q&A
How much sample material do you need for a combined sieve and hydrometer test?
For a standard combined analysis, we typically need about 500 grams of material for a sandy soil and around 200 grams for a predominantly fine-grained soil. The key is that the sample must be representative and large enough to yield at least 50 grams of minus-#40 material for the hydrometer portion. If you are shipping samples from a job site in Savannah, we recommend double-bagging in heavy-duty zip-lock bags and including the boring log or test pit number on each label.
What is the typical turnaround time for grain size analysis in your lab?
Standard turnaround is 3 to 5 business days from sample receipt. The hydrometer test requires a minimum 24-hour sedimentation period with frequent readings during the first hour, so the physical process cannot be shortened. For rush projects in Savannah, we can run multiple cylinders in parallel and deliver preliminary D-values within 48 hours, with the final signed report following shortly after.
Do you report the coefficient of uniformity (Cu) and coefficient of curvature (Cc)?
Yes, we calculate and report Cu (D60/D10) and Cc (D30 squared divided by D60 x D10) on every combined gradation curve. These parameters are essential for evaluating the gradation shape and are routinely requested for filter design, drainage media specification, and liquefaction assessment. We also flag any values that fall outside the typical ranges for Savannah's natural deposits so the design engineer can investigate further.
What does a grain size analysis test cost in the Savannah area?
A complete sieve and hydrometer analysis typically ranges from $100 to $200 per sample, depending on the number of samples in the batch and whether we need to run parallel Atterberg limits on the same material. The wash-#200-only option falls at the lower end of that range. We provide a firm quote after reviewing the project scope and sample count. More info.